DCASE 2018 task 4 results
Overview
This page is intended to analyze how DCASE2018 task 4 submissions performed depending on various metrics. This can help understand what made systems work and improve future systems.
If you want more details or use this work please refer to this paper.
All metrics used in this report have been computed with sed_eval.
You can find more information about the task and the results on DCASE website
For each team, we report only the submissions that obtained the best event based F1-score on the evaluation set.
Original metric
Evaluated metric on the task was an Event based measure with a 200ms collar on onsets and a 200ms / 20% of the events length collar on offsets.
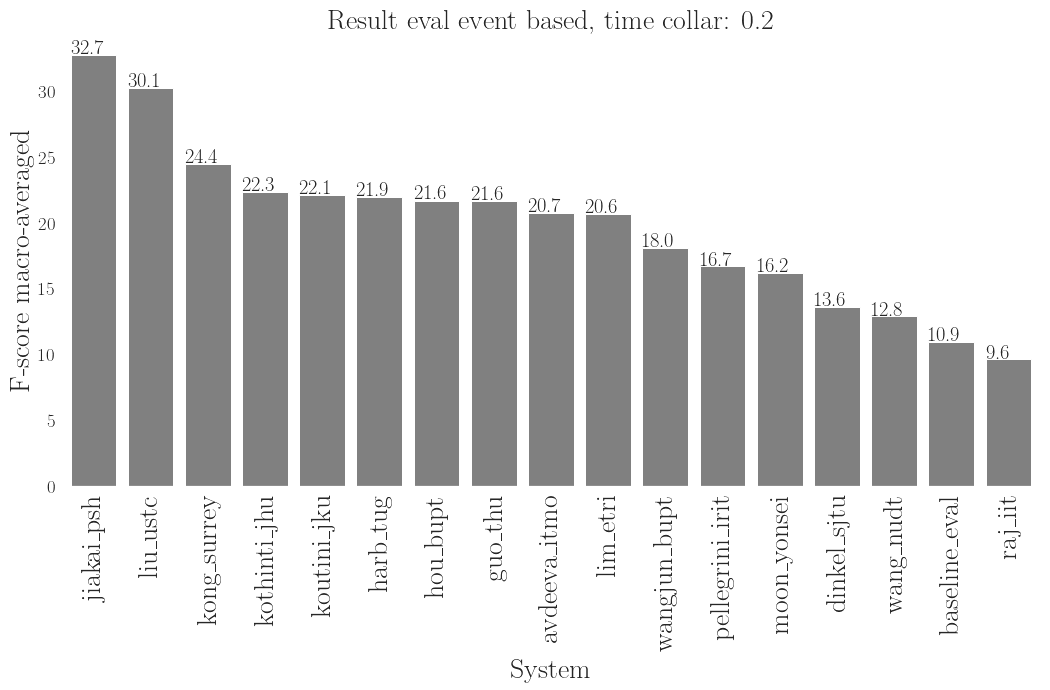
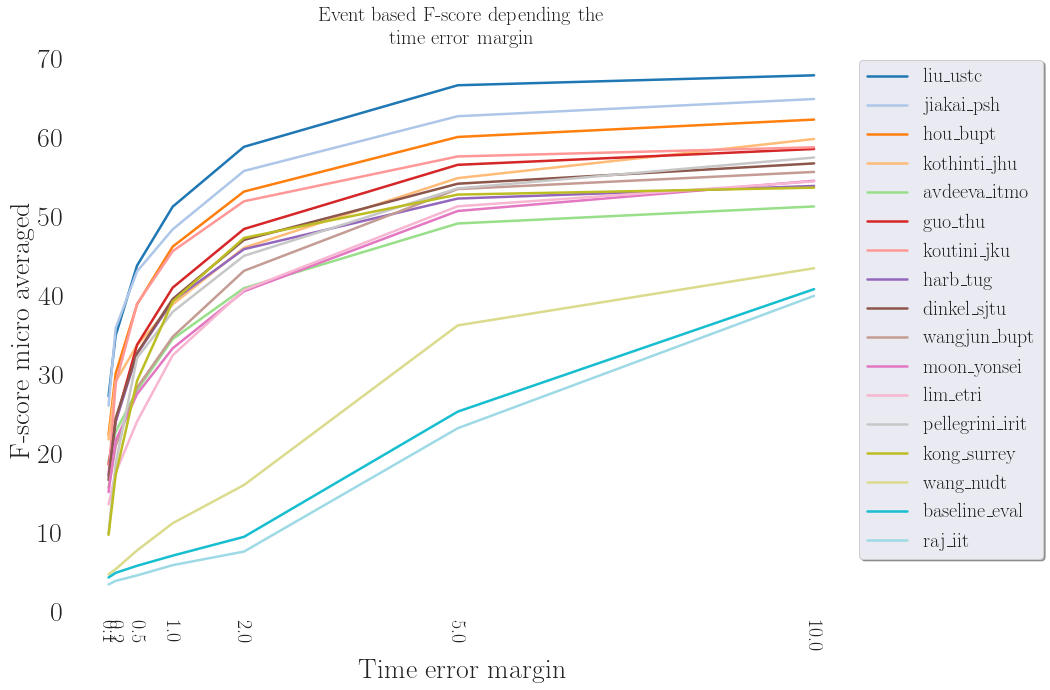
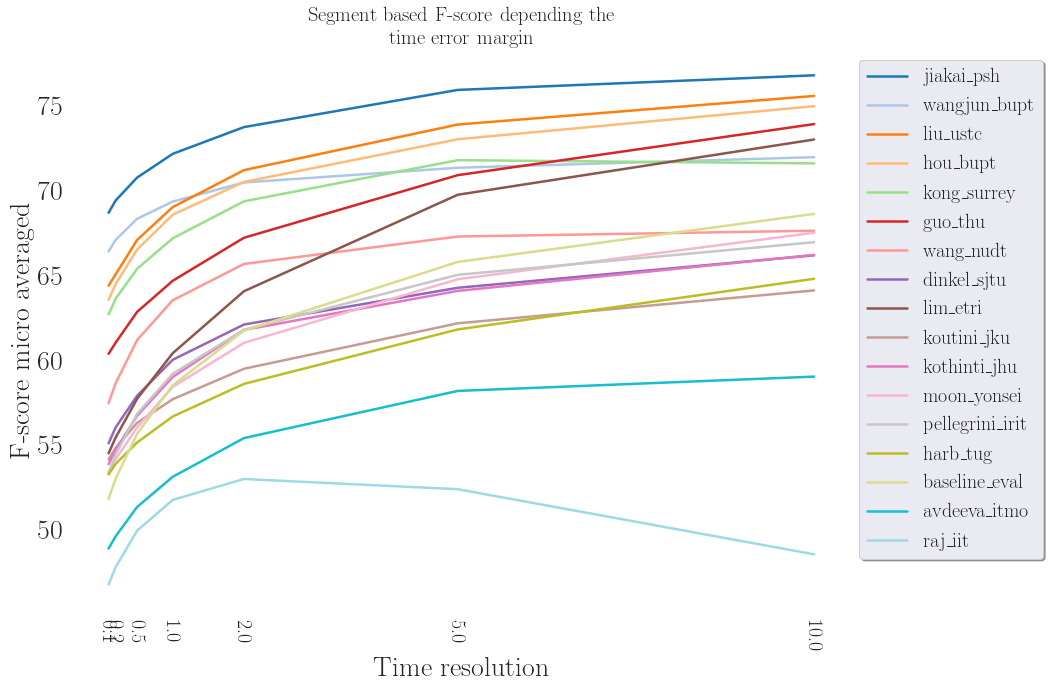
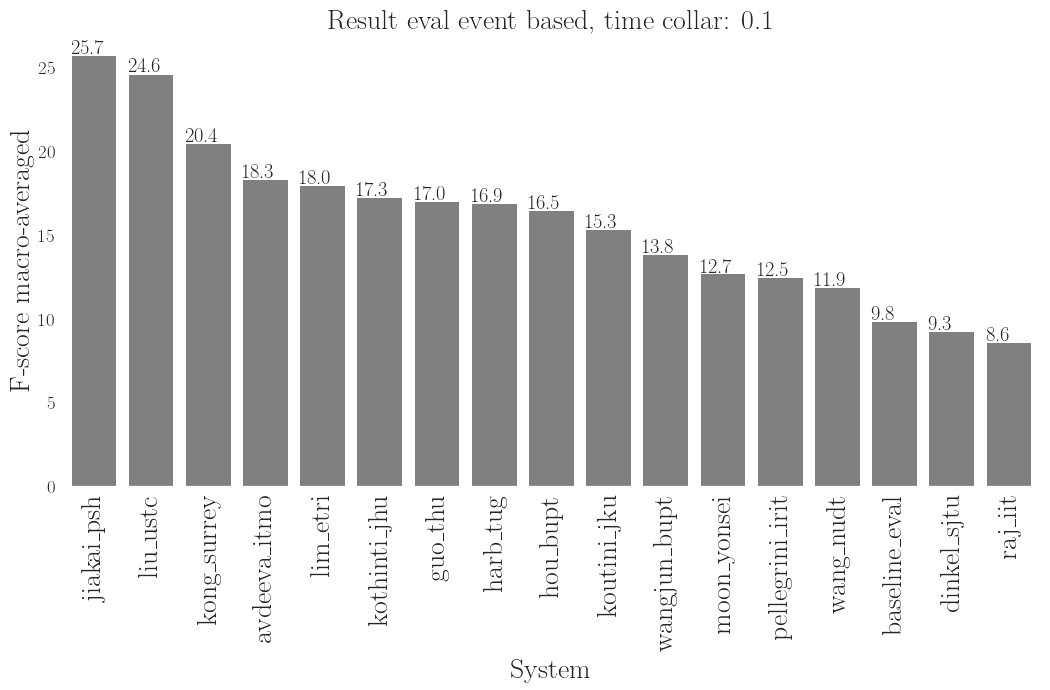
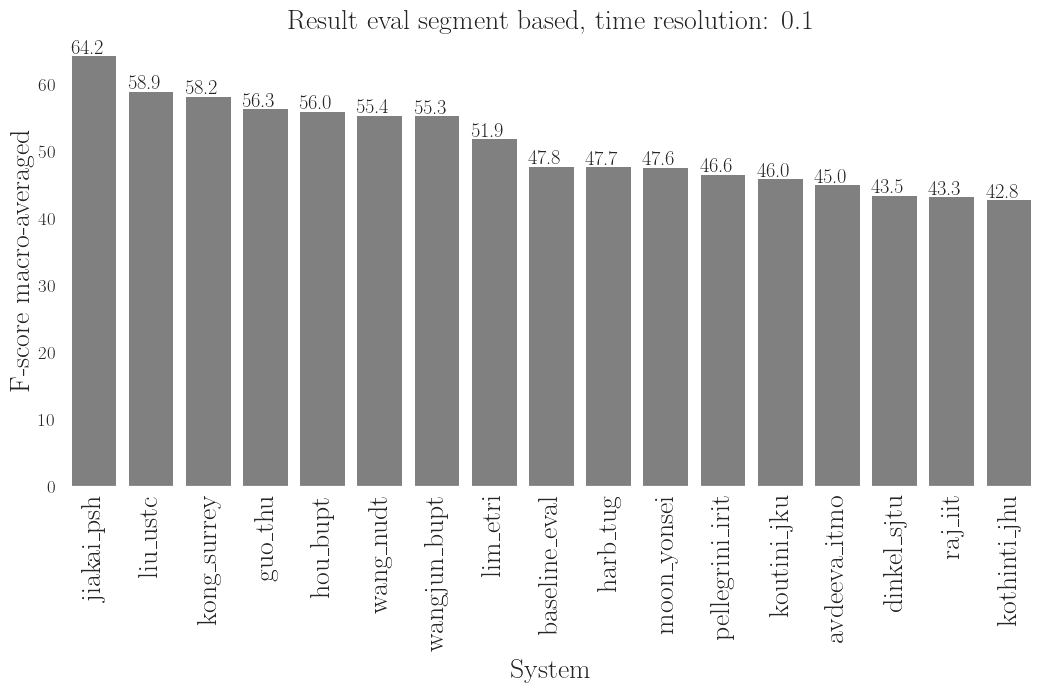
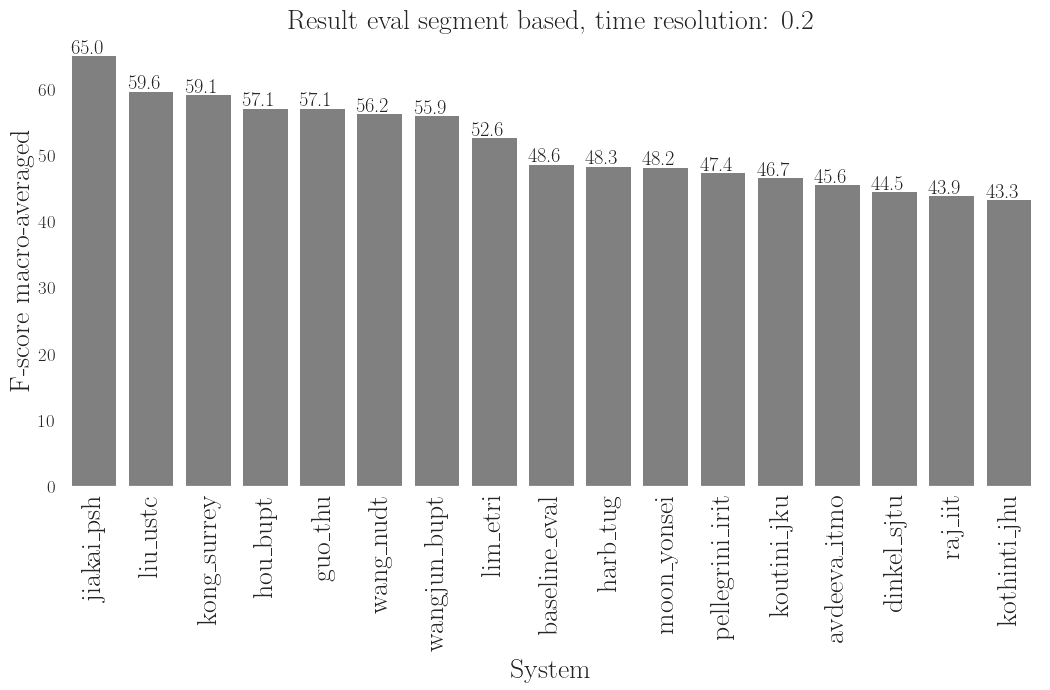
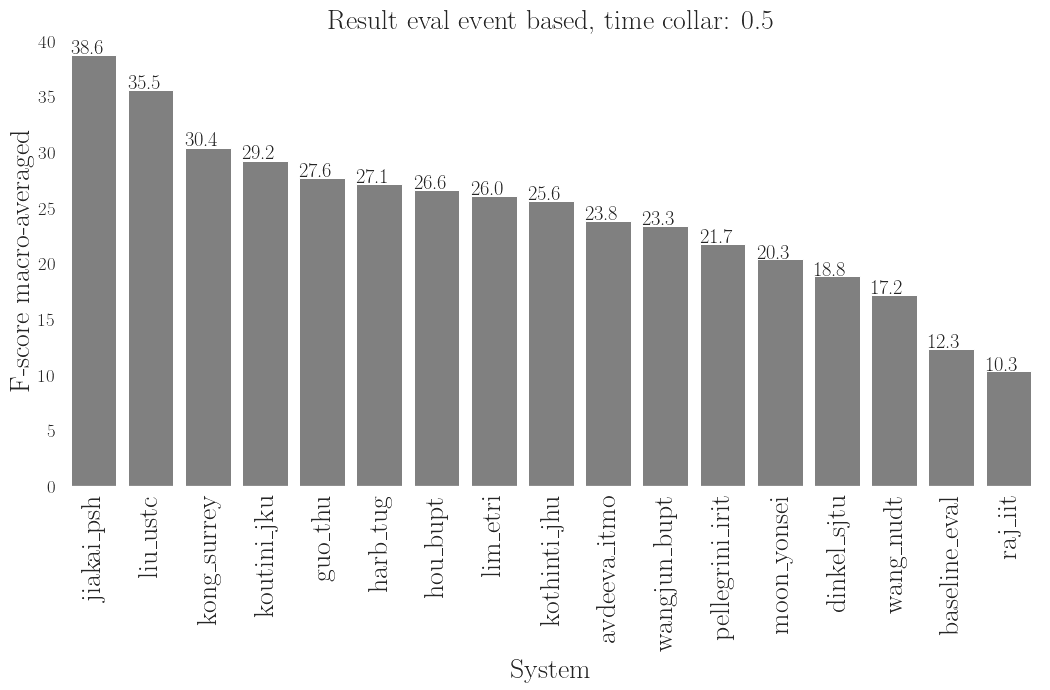
Event based vs segment based
| Event based | Segment based |
|---|---|
 |
 |
-
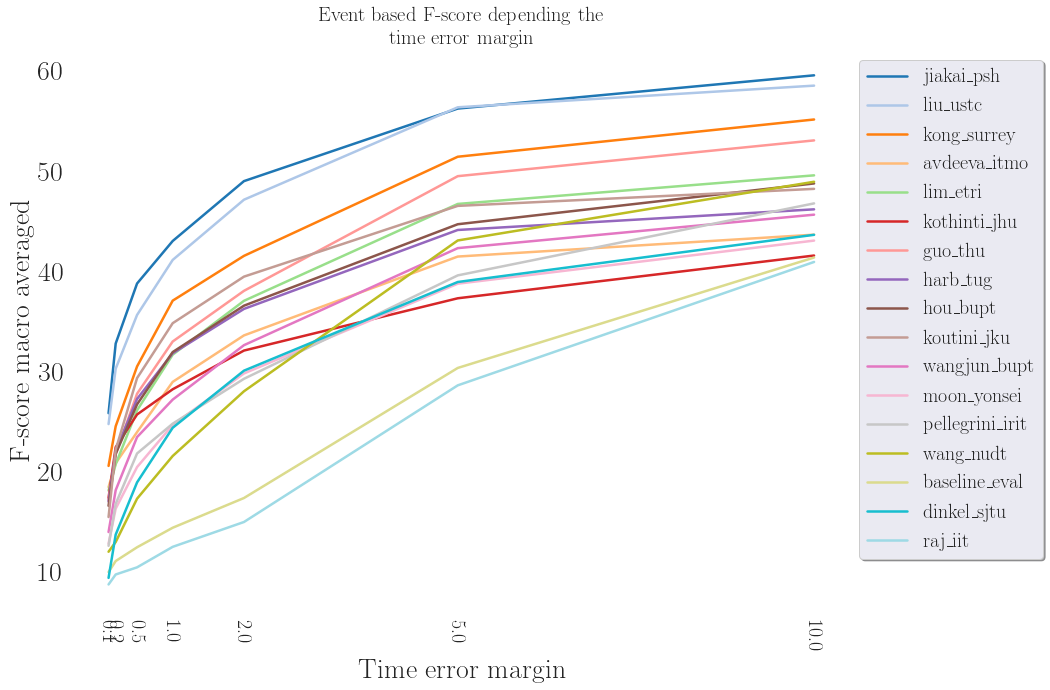
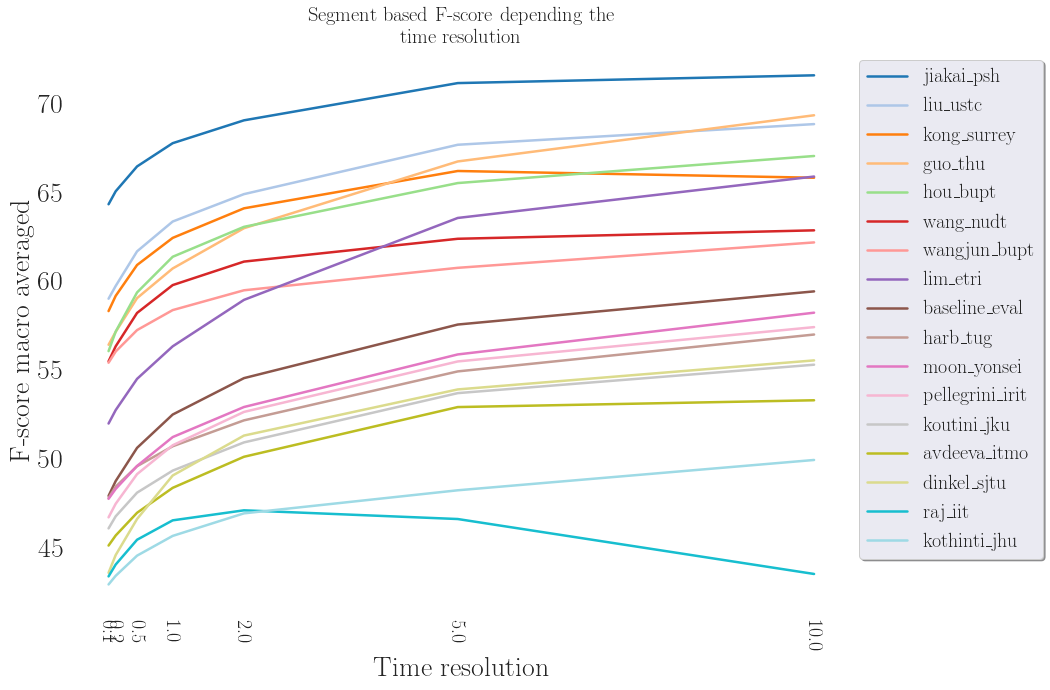
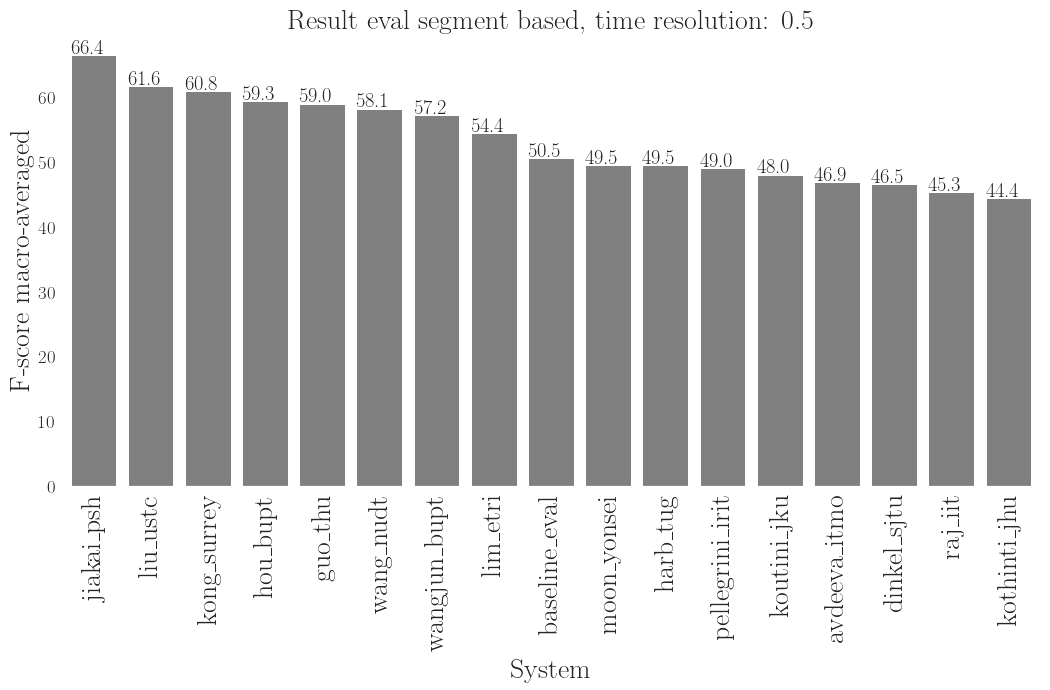
We can notice that segment based metric is much higher (40-70%) than event based metric (5-60%).
-
As we increase the time tolerance in the segment based metric, we are getting closer and closer to an audio tagging score. 10sec segment based metric is the audio tagging performance of systems.
-
We can see in these results that segmentation is an important point in an event based metric. The baseline performance (which does not learn segmentation information and just do median filtering) performs rather well in a segment based metric whereas its performance measured with the event based metric is pretty bad.
See additional material at the bottom of the page to get results associated with 0.1, 0.2 and 0.5 time tolerance.
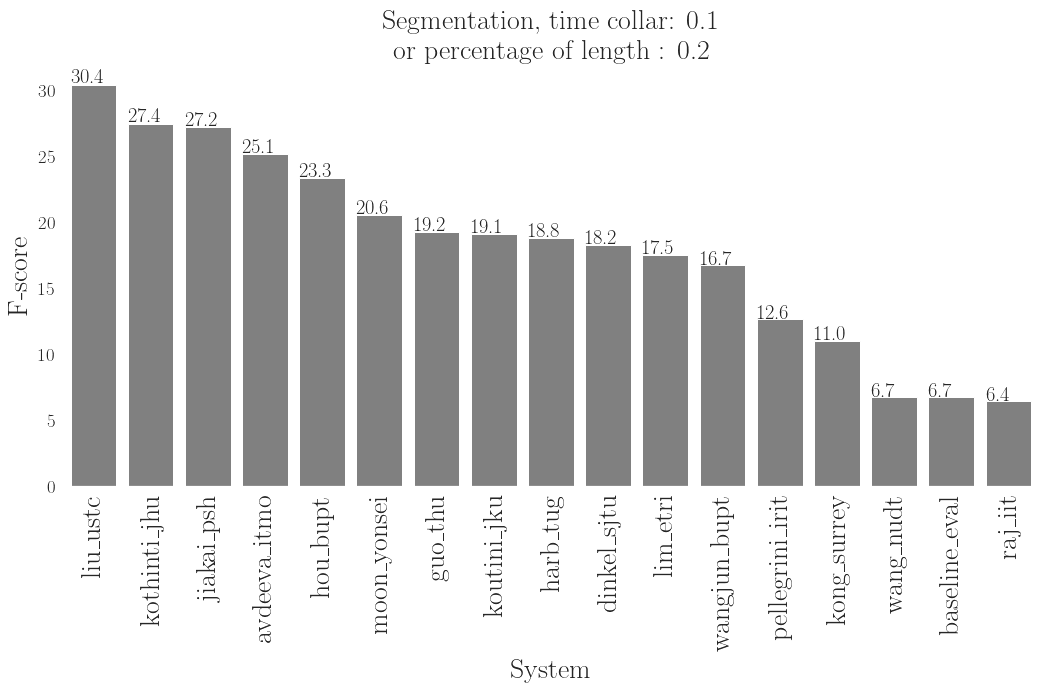
Segmentation
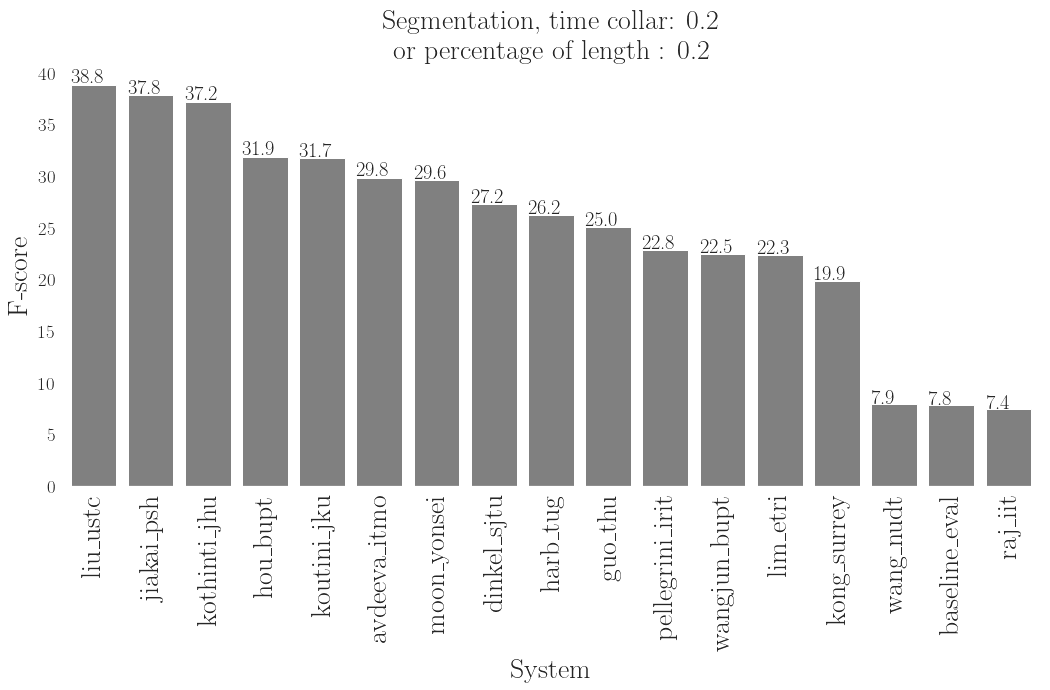
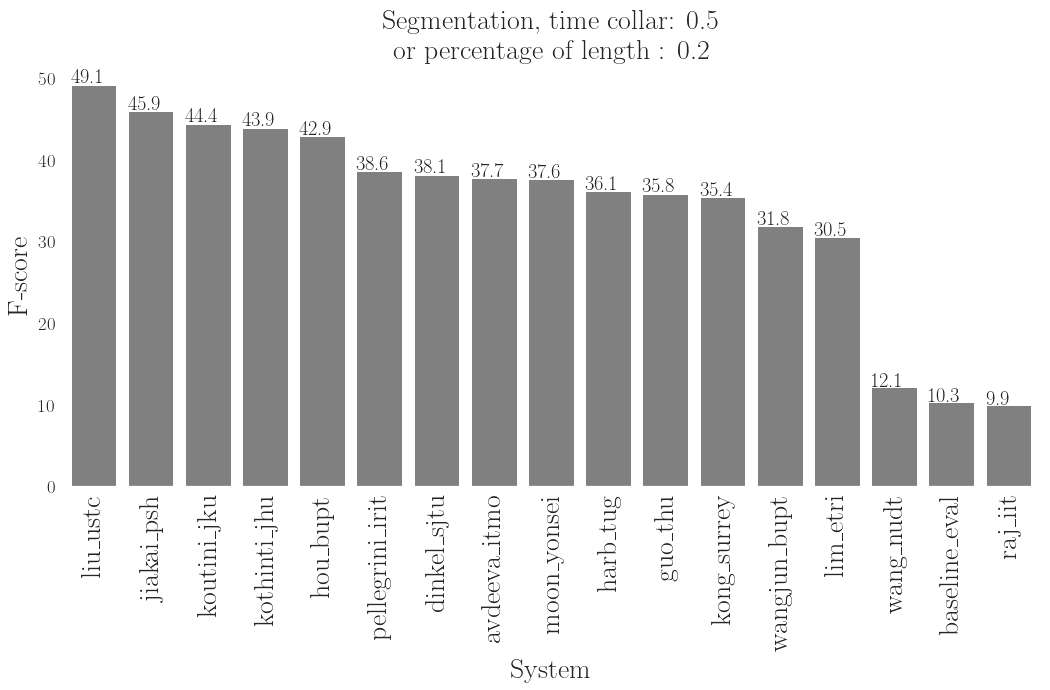
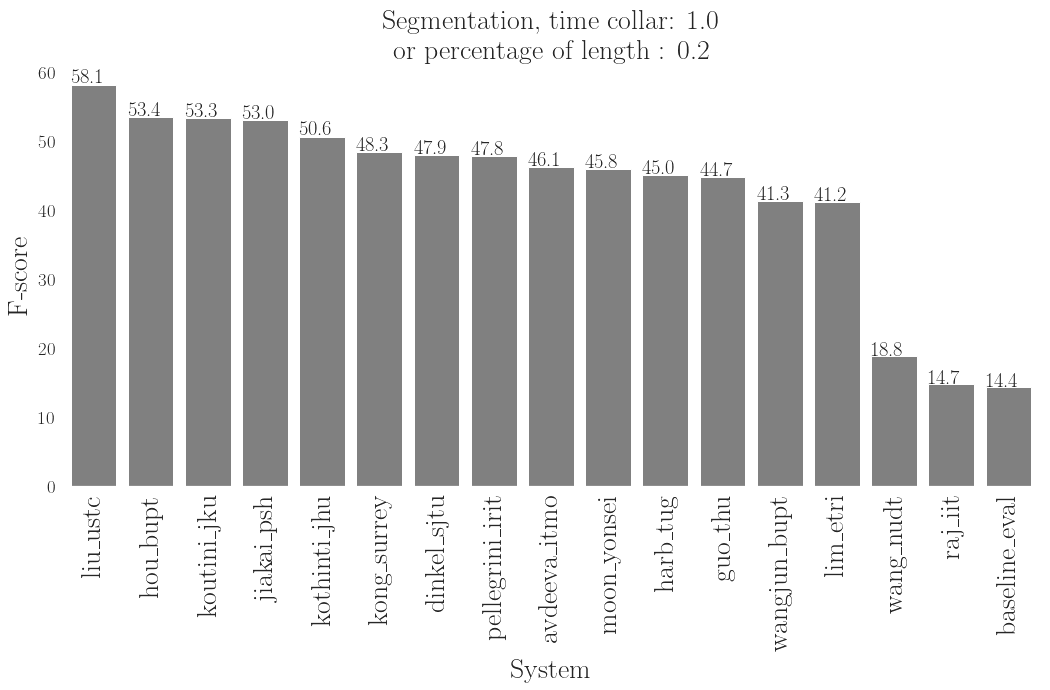
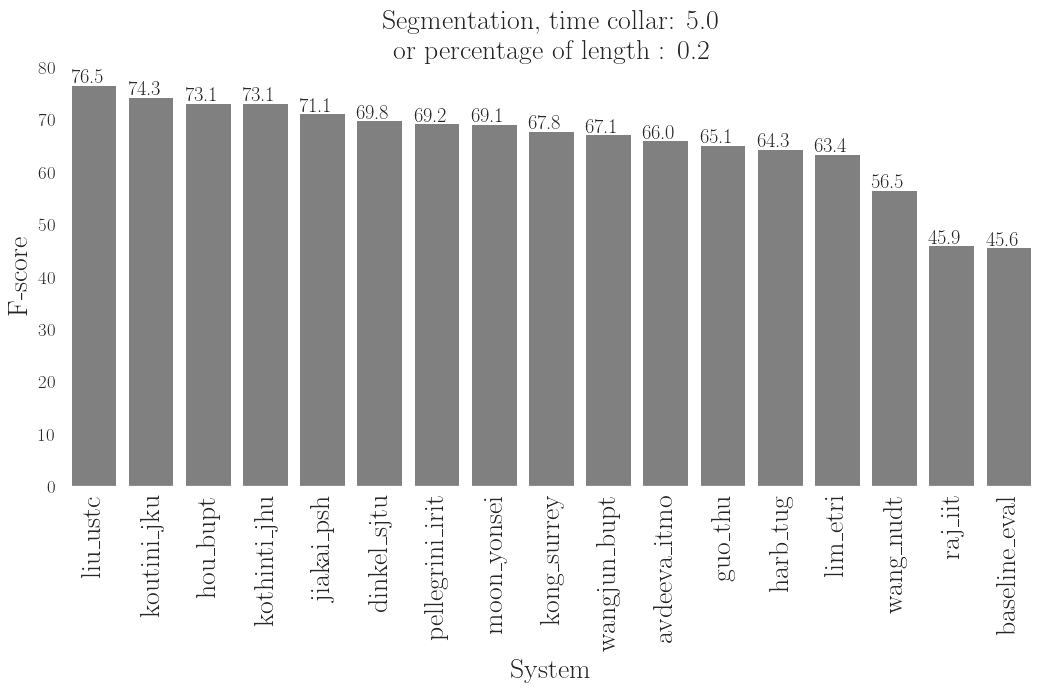
We now focus on segmentation performance, that is computed using event based metric (without taking the class labels into account).
 |
 |
 |
 |
 |
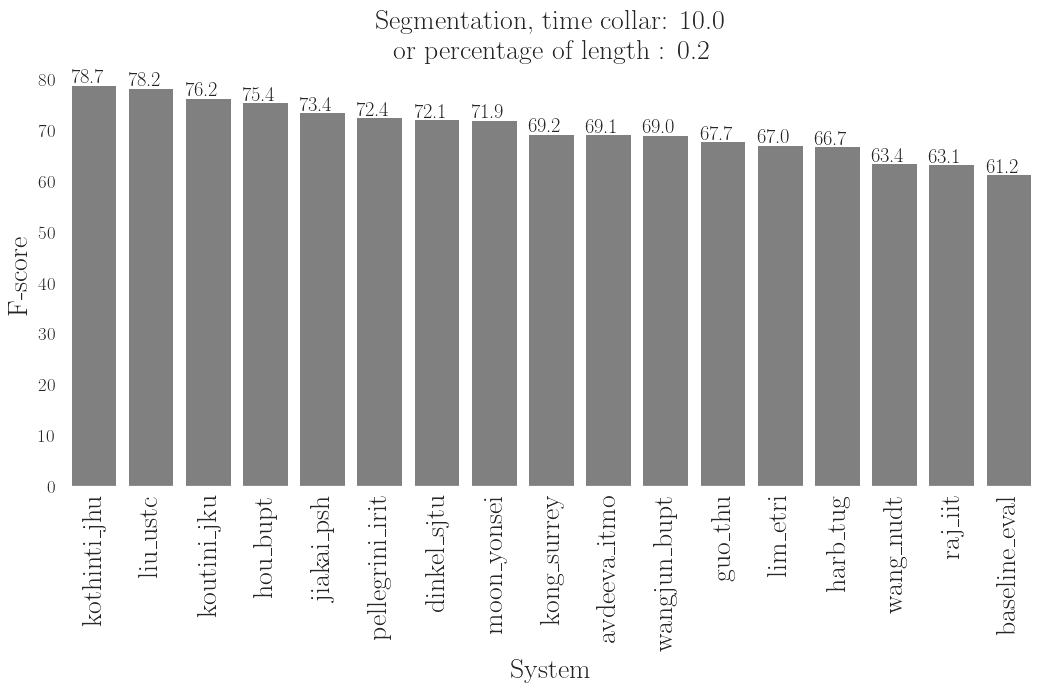 |
- Liu et. al system is the best at segmentation.
- There is a performance gap between third system and the rest. This gap reduces when increasing the tolerance to segmentation error.
- System that rank among the best in terms of segmentation are the systems which actually did implement a segmentation part (not just use smoothing).
- The system that ranked first during the challenge (JaiKai) is ranked betwen the 2nd place and the 5th place in terms of segmentation. The overall ranking is benefiting from very good tagging performance.
- Difference between event-based and segment-based with 10s margin reflects the ability to count events during the clip, not able to count.
- Kong et. al obtained the third position of the challenge without optimizing the segmentation.
- Most of the current systems can predict if an event is active within a time zone but not really segment the audio clip. (From an application point of view, these systems can already help some applications which does not need a precise segmentation)
Duration of events
Duration of events (in the evaluation set):
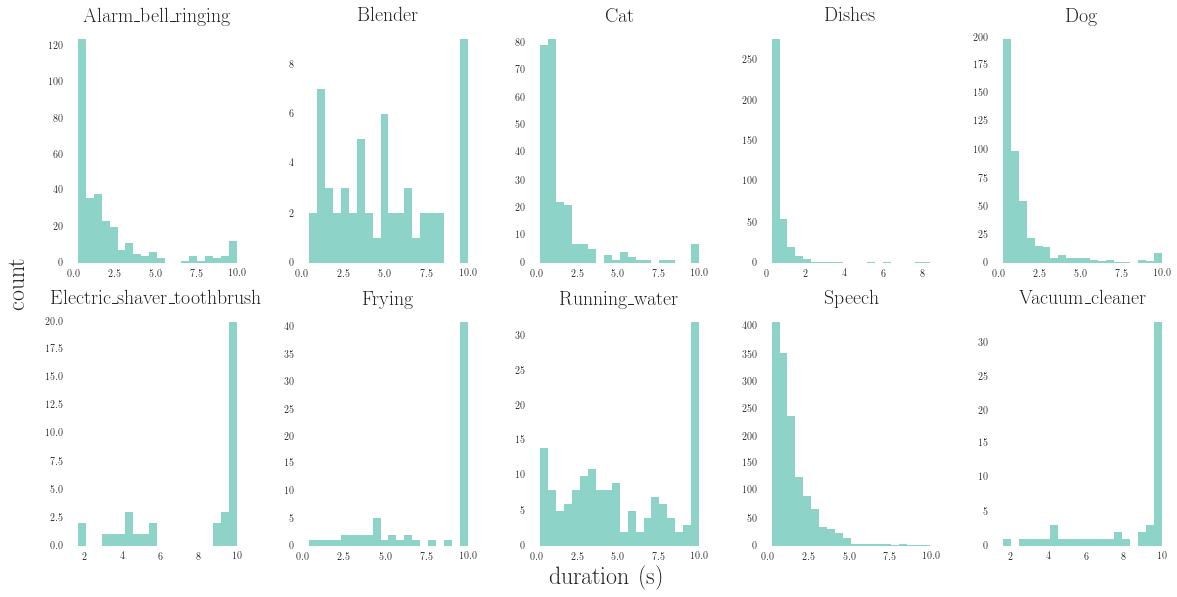
We can see in this plot we can separate events in groups:
- Very short events are: Cat, Dishes and Dog.
- Short events are : Alarm_bell_rinigng and Speech.
- Long events are: Blender, Electric_shaver_toothbrush, Frying, Running_water and Vacuum_cleaner.
The following plot is showing the performances of systems depending on categories of events:
- Short events are (Very short events + short events).
- Long events.
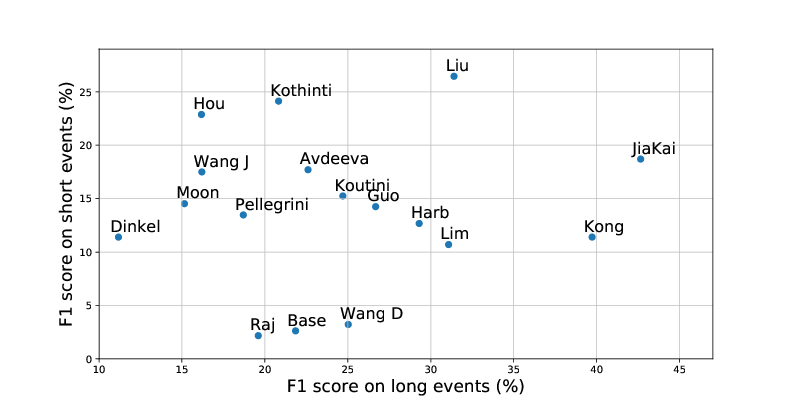
No system is outperforming others both on short and long events.
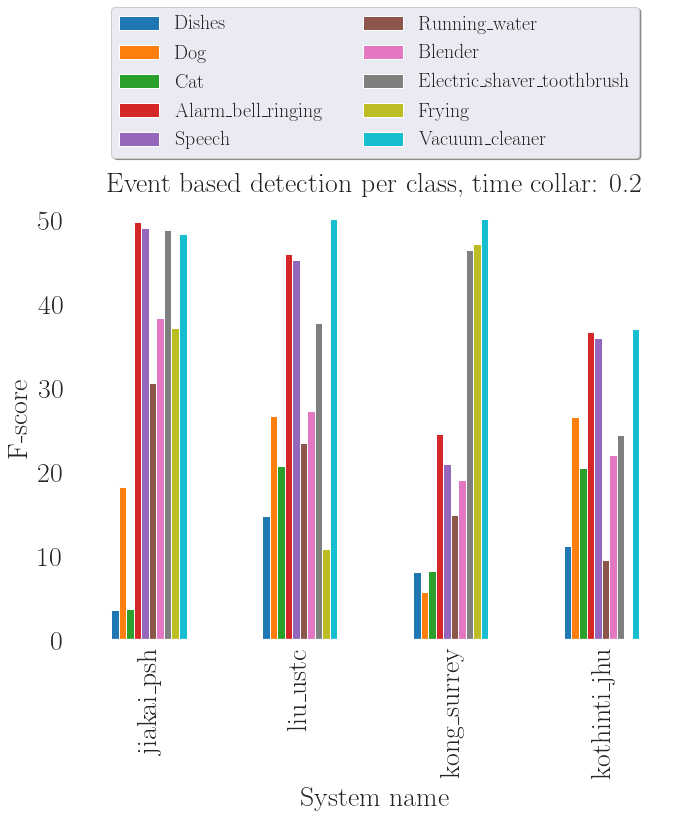
Analysis based on event classes
In the following plots, events are classified from the shortest to the longest (shortest on the left). The median duration is taken to make this order
For showing purposes, when dealing with results per class we only show the results of the first 4 systems.
 |
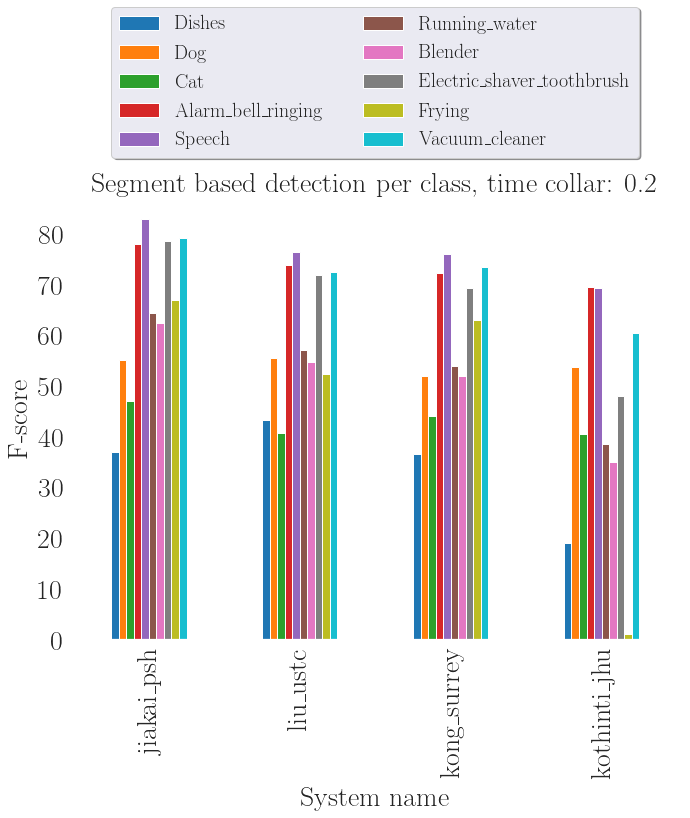 |
There is a clear separation between Dishes, Cat and Dog and the other events. The difference is less important on the segment based metric because the segmentation is less taken into account.
- Kong et. al took advantage of the macro average metric (optimized only on long events ~> audio tagging)
- Liu et al. (ranked 2nd during the challenge) and Kothinti et al. (ranked 4th during the challenge) are performing well on short event (can be linked to the remarks about segmentation above).
- Jiakai system is not optimized for very short events: completely fails to predict Dishes and Cat and has low results for Dishes but performs very well on other classes.
- Kothinti has a good segmentation but lack a good tagging prediction. (Tagging is very low with Frying)
- Speech and Alarm_bell_Ringing seem to be the easiest to detect and classify. These events are not too short (median 1.17s and 0.57s respectively) and with a lot of occurences.
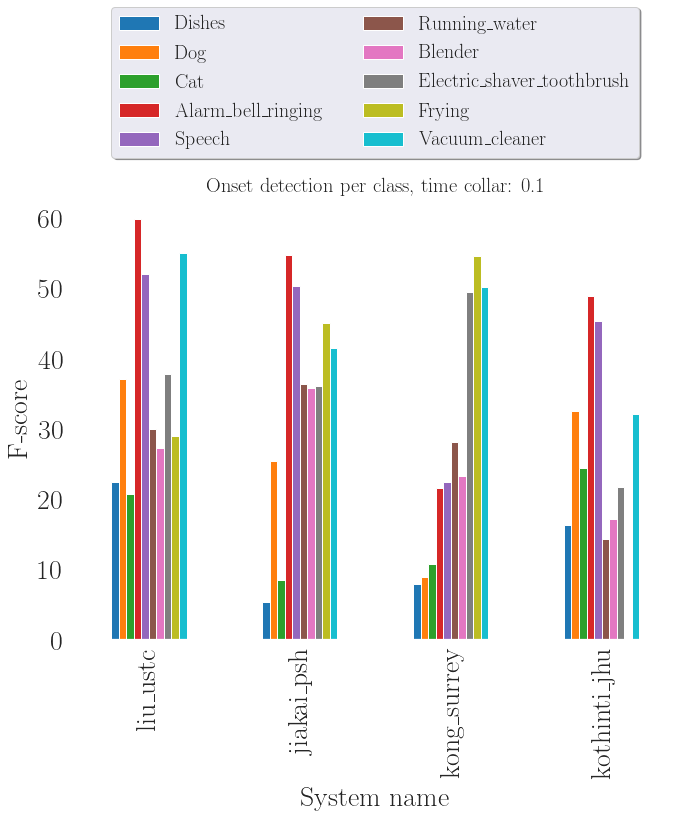
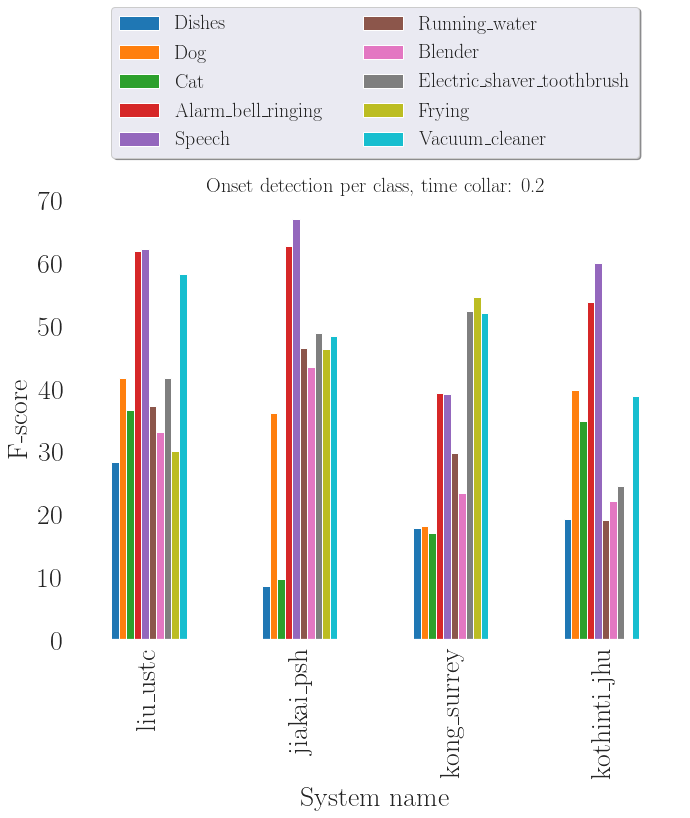
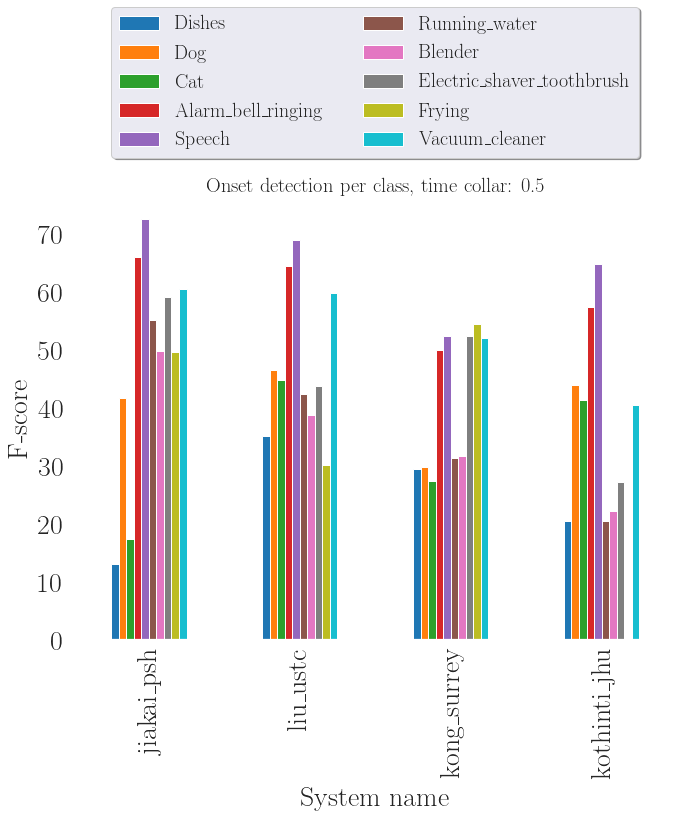
Onset & Offset
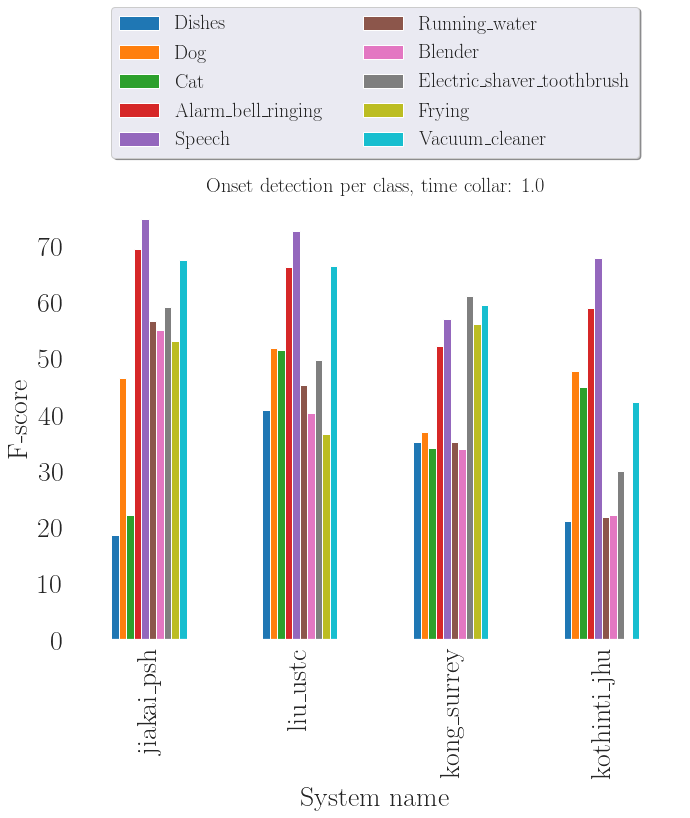
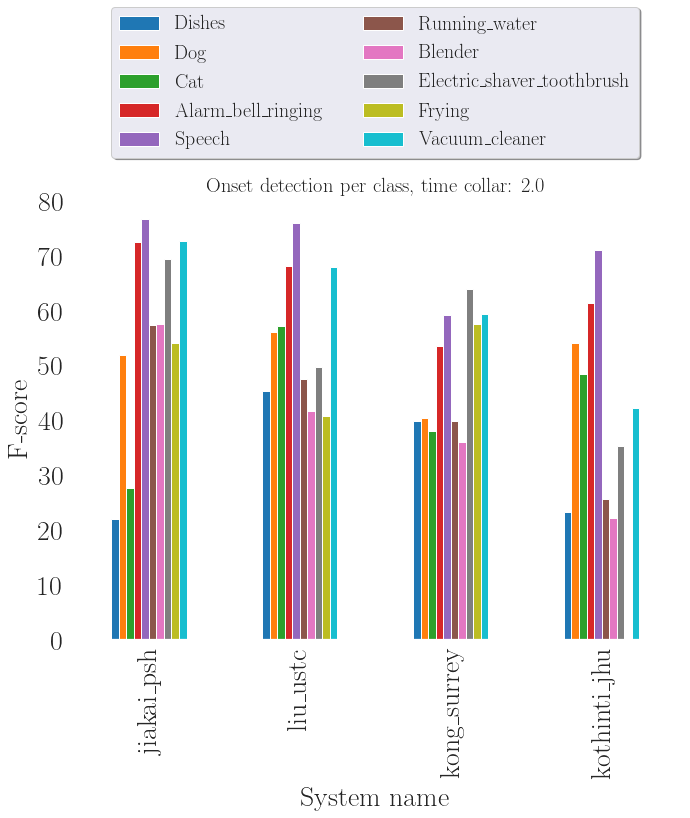
Onset
 |
 |
 |
 |
 |
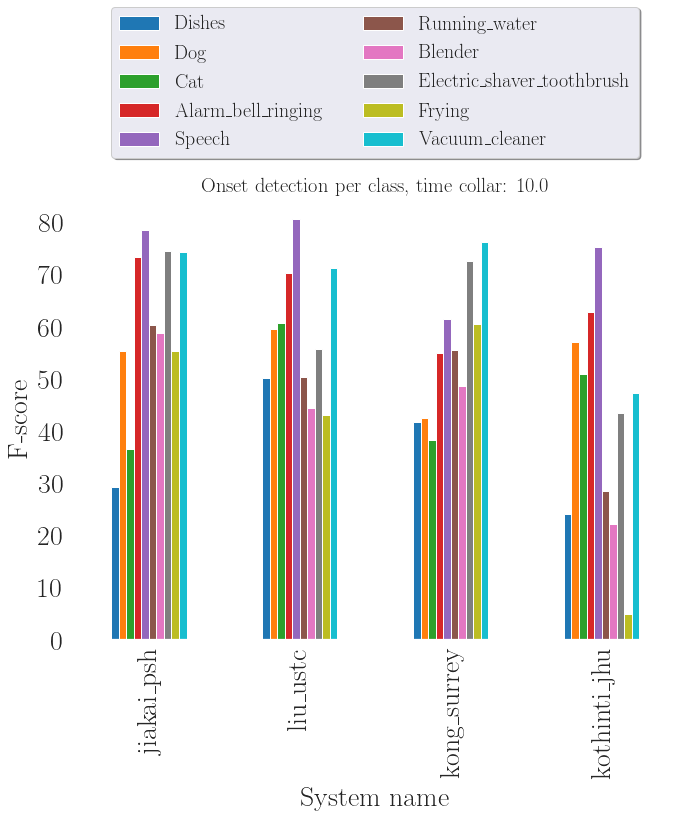 |
- When the metric tolerance is higher that 0.5s then JaiKai becomes better that Liu et al. at detecting onsets.
- Speech and Alarm_bell_ringing generally have a clear onset and appear to be easier to detect.
- Dog onset is the easiest on very short events -> Barking. (Cats are purring and Dishes are not always in the foregroung)
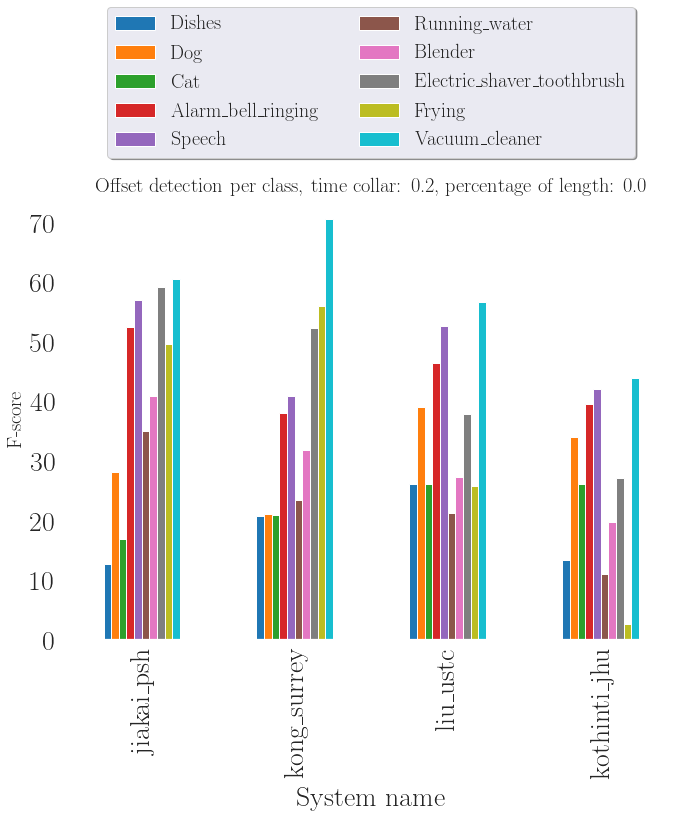
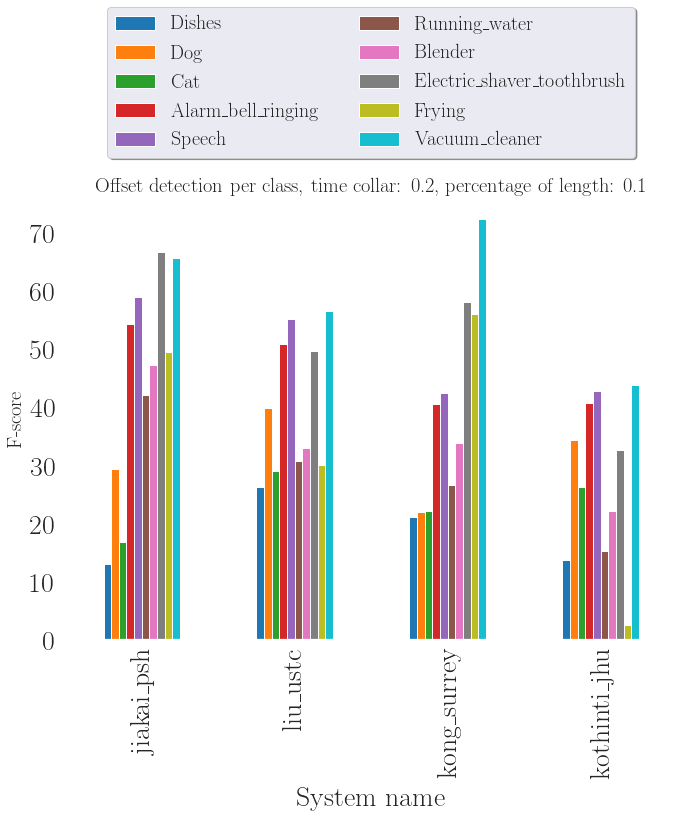
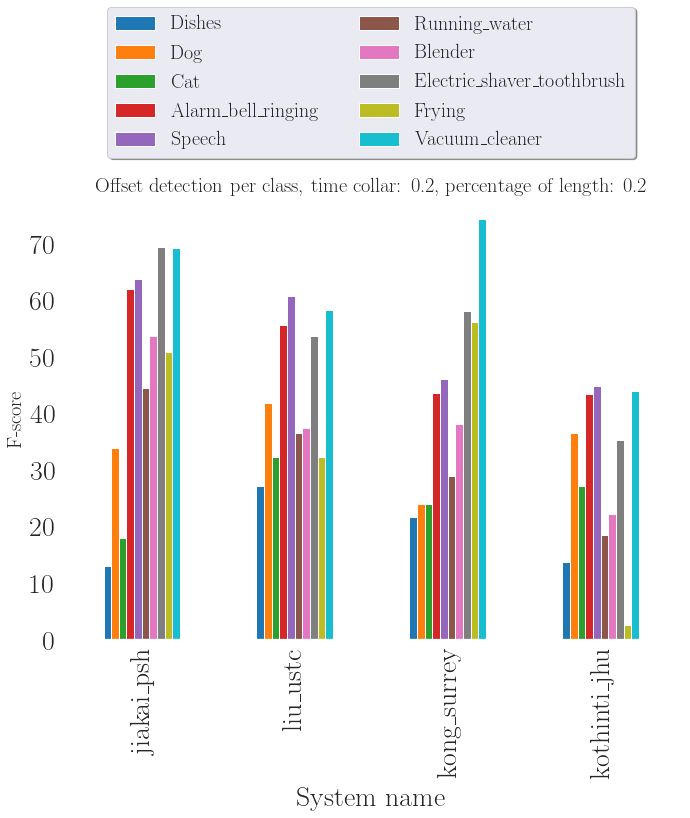
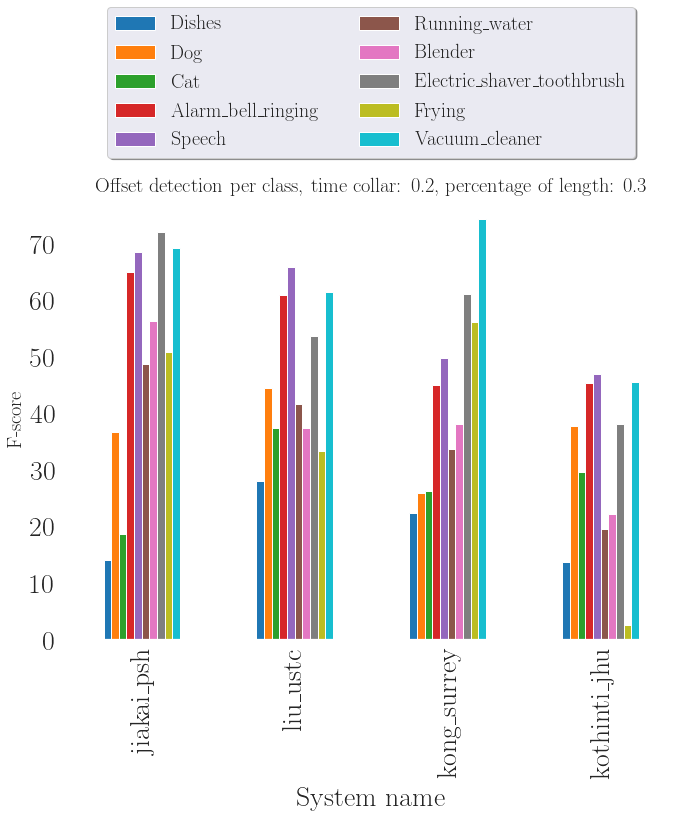
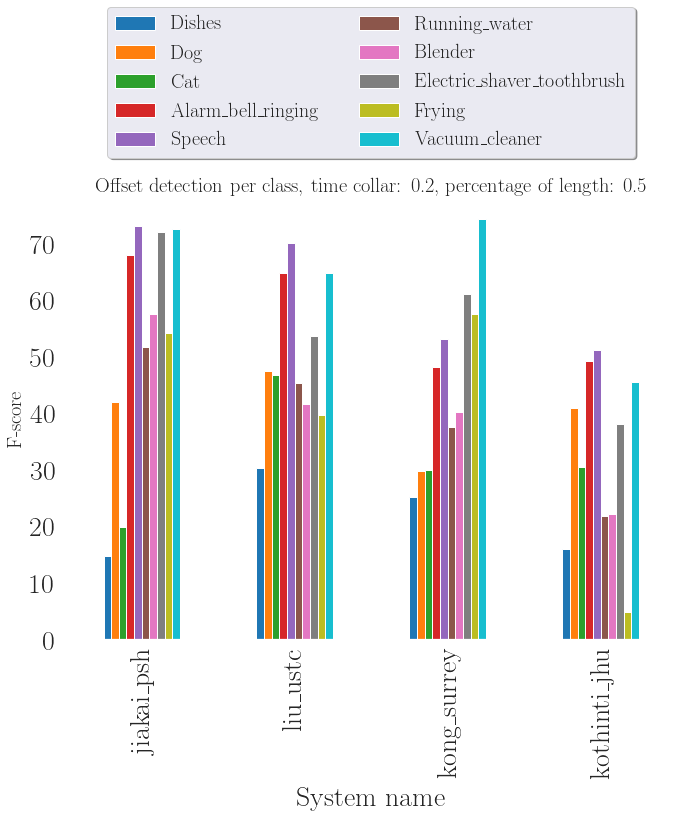
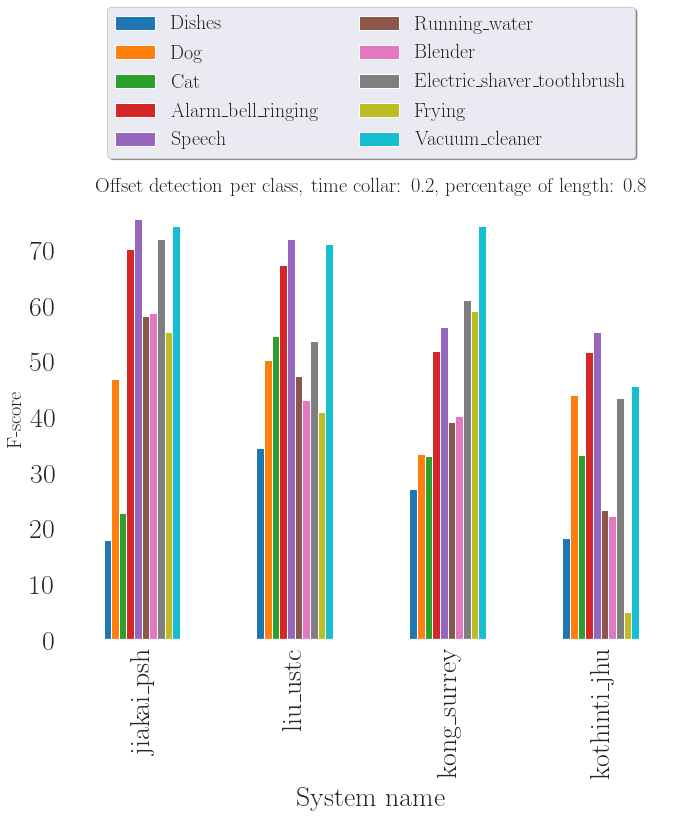
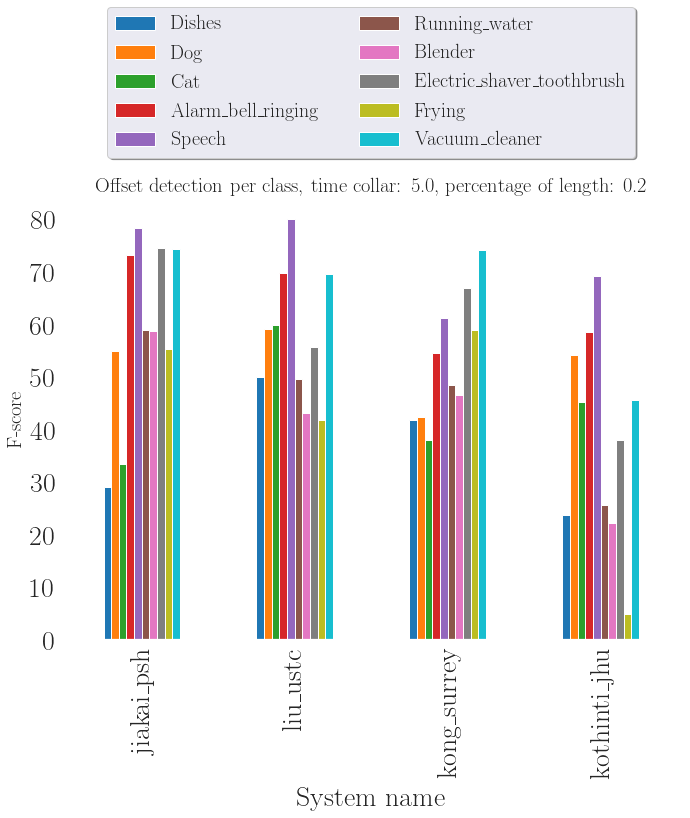
Offset
While dealing with offset detection, there is two aspects: the time tolerance, and the percentage of the length of the event. When both of them are defined, the maximum between them is taken. Therefore, in general, the percentage of length tolerance has more impact on long event and the fixed time tolerance has more impact on short events.
Percentage of event length
 |
 |
 |
 |
 |
 |
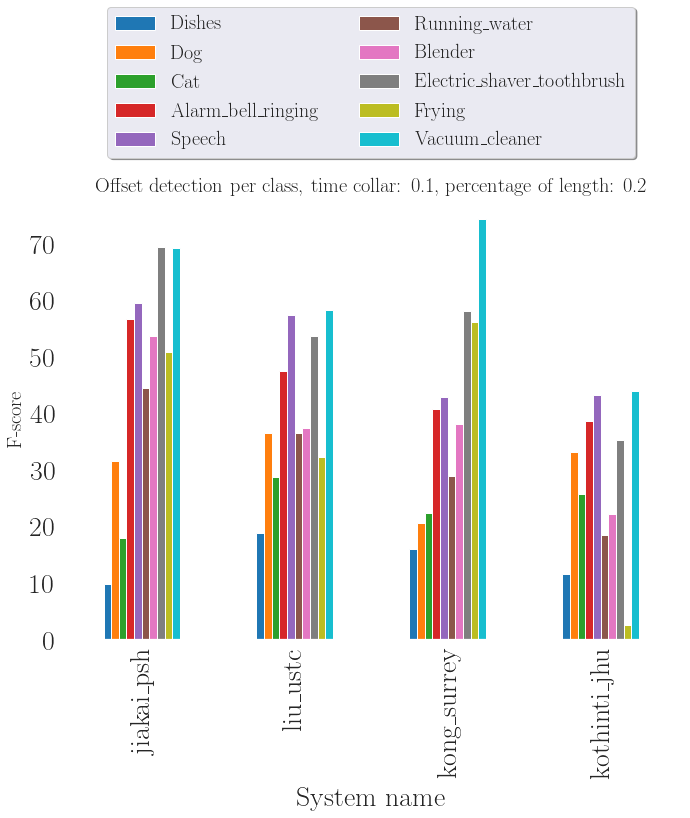
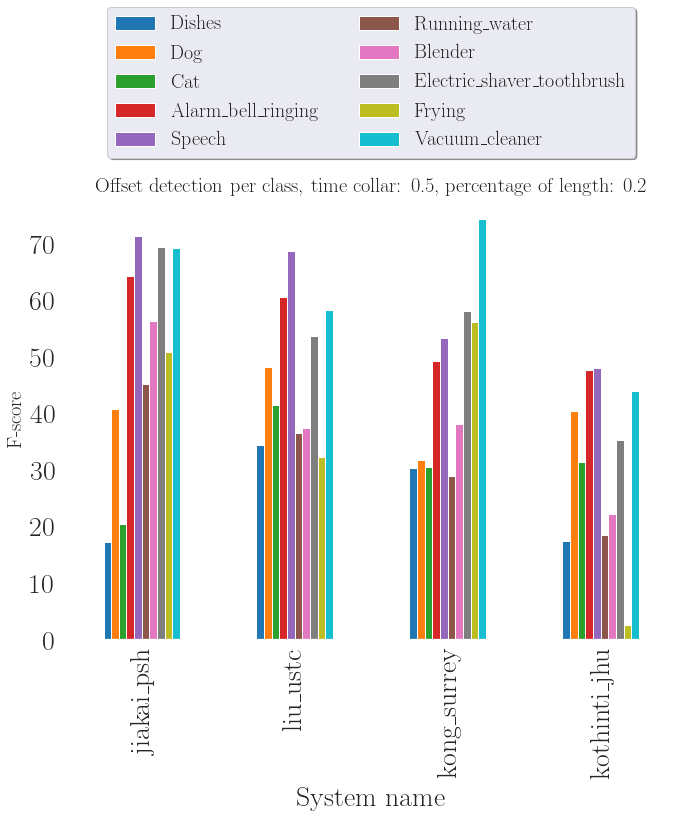
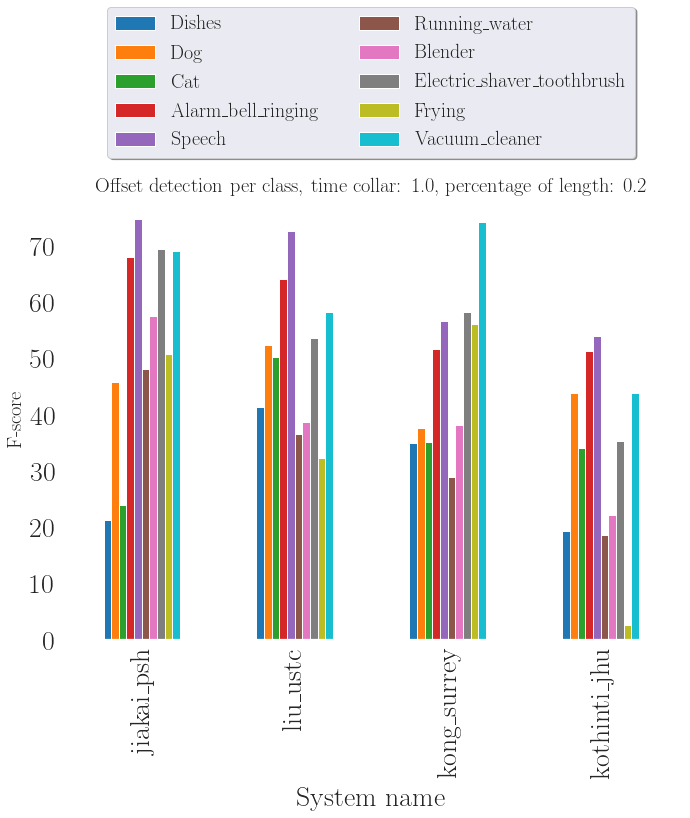
Time collar
 |
|
 |
 |
 |
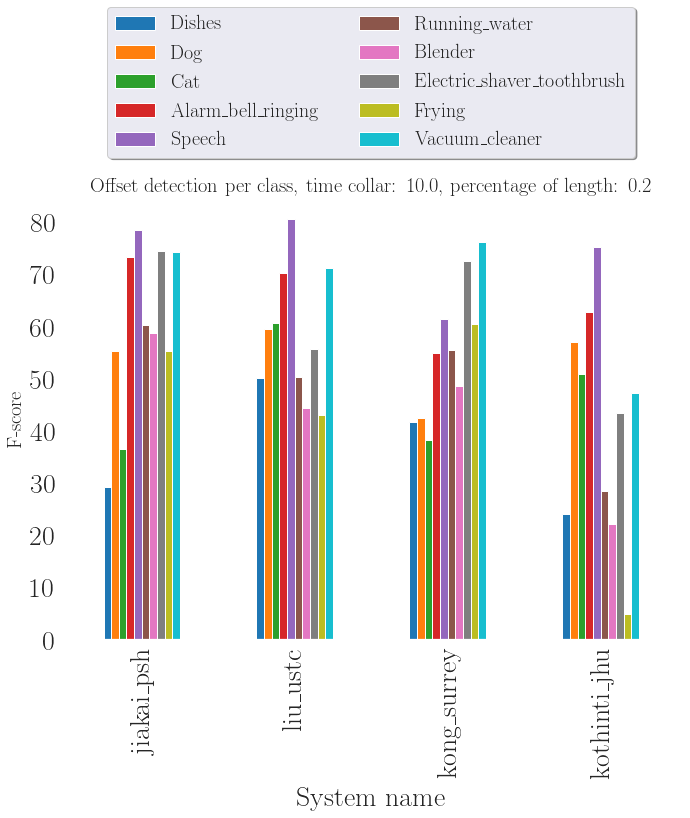 |
- Offsets are harder to recognize than onsets.
- Alarm_bell_ringing and Speech have pretty clear offset and performance is the best on these event classes.
- Running_water and Frying often do not have a clear offset (they also mostly go until the end of the file).
- Jiakai is always the best in offset detection.
- Offset are not really well detected: performance increases drastically with percentage of length or time tolerance.
Systems
- Jiakai system is a mean-teacher model –> best on long events (top 5 in short events)
- For Liu et al. system it is the other way around (use an energy based audio event detection + post-processing: minimum silence between events and minimum event length).
- Kothinti et al. is the 2nd best on short/segmentation (audio event detection based on restricted Boltzmann machine based): good at onset detection but bad at offset detection.
- Dinkel used a GMM-HMM to perform event alignment, then Gaussian posterior filtering as post processing, decent segmentation but tagging part was poor. Therefore, the segmentation was not enough to compensate for the tagging performance.
- Lim used a Viterbi decoding for event localization but it does not perform really well.
- Multiple instance learning did not prove to be so efficient (Pellegrini).
Use of unlabed data
- Use unlabeled data in a mean-teacher setup -> regularization (2% absolute improvement) (JaiKai).
- Pseudo labeling (Koutini et al., Wand D et al., Pellegrini et al., Harb et al., Moon et al.) with high decision threshold (keep only the labels with high confidence) or just pseudo labeling (Liu, Hou) or introducing gradually new samples (Jun Wang).
- Train an unsupervised segmentation (Kothinti).
Complexity
The following chart is extracted from: dcase website (link). It is using js-datatable.
| Rank | Code |
Technical Report |
Event-based F-score (Eval) |
Model complexity |
Classifier |
Ensemble subsystems |
Decision making |
|---|---|---|---|---|---|---|---|
| Avdeeva_ITMO_task4_1 | Avdveeva2018 | 20.1 | 200242 | CRNN, CNN | 2 | hierarchical | |
| Avdeeva_ITMO_task4_2 | Avdveeva2018 | 19.5 | 200242 | CRNN, CNN | 2 | hierarchical | |
| Wang_NUDT_task4_1 | WangD2018 | 12.4 | 24210492 | CRNN | 3 | mean probability | |
| Wang_NUDT_task4_2 | WangD2018 | 12.6 | 24210492 | CRNN | 3 | mean probability | |
| Wang_NUDT_task4_3 | WangD2018 | 12.0 | 24210492 | CRNN | 3 | mean probability | |
| Wang_NUDT_task4_4 | WangD2018 | 12.2 | 24210492 | CRNN | 3 | mean probability | |
| Dinkel_SJTU_task4_1 | Dinkel2018 | 10.4 | 1781259 | HMM-GMM, GRU | |||
| Dinkel_SJTU_task4_2 | Dinkel2018 | 10.7 | 126219 | HMM-GMM, CRNN | |||
| Dinkel_SJTU_task4_3 | Dinkel2018 | 13.4 | 126219 | HMM-GMM, CRNN | |||
| Dinkel_SJTU_task4_4 | Dinkel2018 | 11.2 | 126090 | CRNN | |||
| Guo_THU_task4_1 | Guo2018 | 21.3 | 970644 | multi-scale CRNN | 2 | ||
| Guo_THU_task4_2 | Guo2018 | 20.6 | 970644 | multi-scale CRNN | 2 | ||
| Guo_THU_task4_3 | Guo2018 | 19.1 | 970644 | multi-scale CRNN | 2 | ||
| Guo_THU_task4_4 | Guo2018 | 19.0 | 970644 | multi-scale CRNN | 2 | ||
| Harb_TUG_task4_1 | Harb2018 | 19.4 | 497428 | CRNN, VAT | |||
| Harb_TUG_task4_2 | Harb2018 | 15.7 | 497428 | CRNN, VAT | |||
| Harb_TUG_task4_3 | Harb2018 | 21.6 | 497428 | CRNN, VAT | |||
| Hou_BUPT_task4_1 | Hou2018 | 19.6 | 1166484 | CRNN | |||
| Hou_BUPT_task4_2 | Hou2018 | 18.9 | 1166484 | CRNN | |||
| Hou_BUPT_task4_3 | Hou2018 | 20.9 | 1166484 | CRNN | |||
| Hou_BUPT_task4_4 | Hou2018 | 21.1 | 1166484 | CRNN | |||
| CANCES_IRIT_task4_1 | Cances2018 | 8.4 | 126090 | CRNN | |||
| PELLEGRINI_IRIT_task4_2 | Cances2018 | 16.6 | 1040724 | CNN, CRNN with Multi-Instance Learning | |||
| Kothinti_JHU_task4_1 | Kothinti2018 | 20.6 | 1540854 | CRNN, RBM, cRBM, PCA | |||
| Kothinti_JHU_task4_2 | Kothinti2018 | 20.9 | 1540854 | CRNN, RBM, cRBM, PCA | |||
| Kothinti_JHU_task4_3 | Kothinti2018 | 20.9 | 1189290 | CRNN, RBM, cRBM, PCA | |||
| Kothinti_JHU_task4_4 | Kothinti2018 | 22.4 | 1540854 | CRNN, RBM, cRBM, PCA | |||
| Koutini_JKU_task4_1 | Koutini2018 | 21.5 | 126090 | CRNN | |||
| Koutini_JKU_task4_2 | Koutini2018 | 21.1 | 126090 | CRNN | |||
| Koutini_JKU_task4_3 | Koutini2018 | 20.6 | 126090 | CRNN | |||
| Koutini_JKU_task4_4 | Koutini2018 | 18.8 | 126090 | CRNN | |||
| Liu_USTC_task4_1 | Liu2018 | 27.3 | 3478026 | Capsule-RNN, ensemble | 8 | dynamic threshold | |
| Liu_USTC_task4_2 | Liu2018 | 28.8 | 534460 | Capsule-RNN, ensemble | 2 | dynamic threshold | |
| Liu_USTC_task4_3 | Liu2018 | 28.1 | 4012486 | Capsule-RNN, CRNN, ensemble | 9 | dynamic threshold | |
| Liu_USTC_task4_4 | Liu2018 | 29.9 | 4012486 | Capsule-RNN, CRNN, ensemble | 10 | dynamic threshold | |
| LJK_PSH_task4_1 | Lu2018 | 24.1 | 1382246 | CRNN | 4 | mean probabilities | |
| LJK_PSH_task4_2 | Lu2018 | 26.3 | 1382246 | CRNN | 2 | mean probabilities | |
| LJK_PSH_task4_3 | Lu2018 | 29.5 | 1382246 | CRNN | |||
| LJK_PSH_task4_4 | Lu2018 | 32.4 | 1382246 | CRNN | |||
| Moon_YONSEI_task4_1 | Moon2018 | 15.9 | 10902218 | GLU, Bi-RNN, ResNet, SENet, Multi-level | |||
| Moon_YONSEI_task4_2 | Moon2018 | 14.3 | 10902218 | GLU, Bi-RNN, ResNet, SENet, Multi-level | |||
| Raj_IITKGP_task4_1 | Raj2018 | 9.4 | 215890 | CRNN | |||
| Lim_ETRI_task4_1 | Lim2018 | 17.1 | 239338 | CRNN | |||
| Lim_ETRI_task4_2 | Lim2018 | 18.0 | 239338 | CRNN | |||
| Lim_ETRI_task4_3 | Lim2018 | 19.6 | 239338 | CRNN | |||
| Lim_ETRI_task4_4 | Lim2018 | 20.4 | 239338 | CRNN | |||
| WangJun_BUPT_task4_2 | WangJ2018 | 17.9 | 1263508 | RNN,BGRU,self-attention | |||
| DCASE2018 baseline | Serizel2018 | 10.8 | 126090 | CRNN | |||
| Baseline_Surrey_task4_1 | Kong2018 | 18.6 | 4691274 | VGGish 8 layer CNN with global max pooling | |||
| Baseline_Surrey_task4_2 | Kong2018 | 16.7 | 4309450 | AlexNetish 4 layer CNN with global max pooling | |||
| Baseline_Surrey_task4_3 | Kong2018 | 24.0 | 4691274 | VGGish 8 layer CNN with global max pooling, fuse SED and non-SED |
- Best system with the same complexity as the baseline: 21.5% (Koutini et al.) also the only top performing system to try something else than mel spectrum.
- Overall best system, 10 times more parameters than the baseline (JiaKai).
- Most complex system (24M parameters) ranked 15/16
- Systems using raw waveform and MFCC were among the most complex (and with the worst performance).
Additional material
Micro average
 |
 |
This illustrates clearly the systems taking advantage of the macro average metric. Most systems succeed better. When a class is short and not enough represented, it is hard to detect it.
Event based vs segment based
| Event based | Segment based |
|---|---|
 |
 |
|
 |
 |
 |

Nicolas Turpault
PhD student in ambient sound analysis at Inria Nancy.

Romain Serizel
Associate Professor at Université de Lorraine.